
Ask an average A320 pilot to define Green Dot speed and you’re likely to get some highly entertaining, generally vague and mostly incorrect responses.
In other words, there are a lot of guys out there who can’t explain it because they don’t know what it is in the first place! But no worries, Mate, because in this lesson, I’ll show you how to be the exception.
Airbus defines Green Dot as the engine-out operating speed in the clean configuration.
Operationally it corresponds to the speed that allows the highest climb gradient with one engine inoperative when in the clean configuration.
It’s important to remember that the total drag on an aircraft consists of both Induced drag and Parasite drag.
As you can see, Green Dot lies at the intersection of these two drag curves.
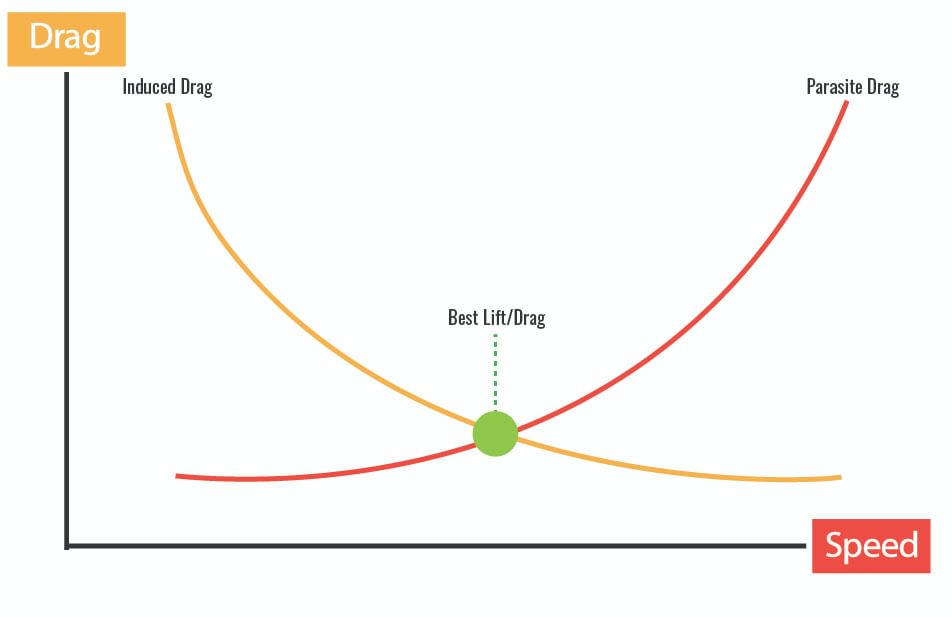
Green Dot has been calculated to provide the best L/D for a given altitude, temperature, mach and weight in the clean configuration with one engine out.
This definition explains why GREEN DOT is used for an engine failure in cruise when the obstacle strategy (drift-down) is required.
In these cases, the crew must preserve altitude for as long as possible due to high terrain.
Thus, it’s necessary to use a speed that provides the lowest rate and angle of descent.
GREEN DOT is this speed.
While Green Dot is technically defined with reference to engine out cases, when all engines are operating normally, Green Dot speed will still give you a very close approximation of the Best Lift-to-Drag ratio speed.
Seeing just how GREEN DOT relates to the aircraft’s thrust and drag can help us to better understand why things can get unpleasant if you get too slow.
Let’s take a closer look…
There’s a fair bit going on here, so let’s break this graph down together.
(It may help to open up the image in another window, so you can switch between reading the text and looking at the image).
First, check out those drag curves, and once again, note that the total drag consists of two drag subtypes, induced and parasite.
Induced drag (orangey-yellow) increases at slower speeds (moving left on the graph).
Parasite drag (red) increases at higher speeds. (moving right on the graph).
Remember, Green Dot = Best L/D speed!
Start at Green Dot and move your finger along the drag curve in either direction.
You’ll quickly see that flight at any speed that isn’t Green Dot will cause either parasite or induced drag to increase.
This means that drag increases for any speed that isn’t GREEN DOT.
Sometimes I see guys getting high on profile and in a panic, they slow to Green Dot.
This is exactly the opposite of what you want to do, since Green Dot gives you the best L/D, or in other words, the least amount of drag!
Flight at any speed that isn’t Green Dot will cause either Induced or Parasite drag to increase.

Ready for your next Checkride?
Probably not as ready as you should be.
Certainly not as ready as you could be.
Click here to find out more about the world’s first and finest, complete emergency management system designed especially for the A320.
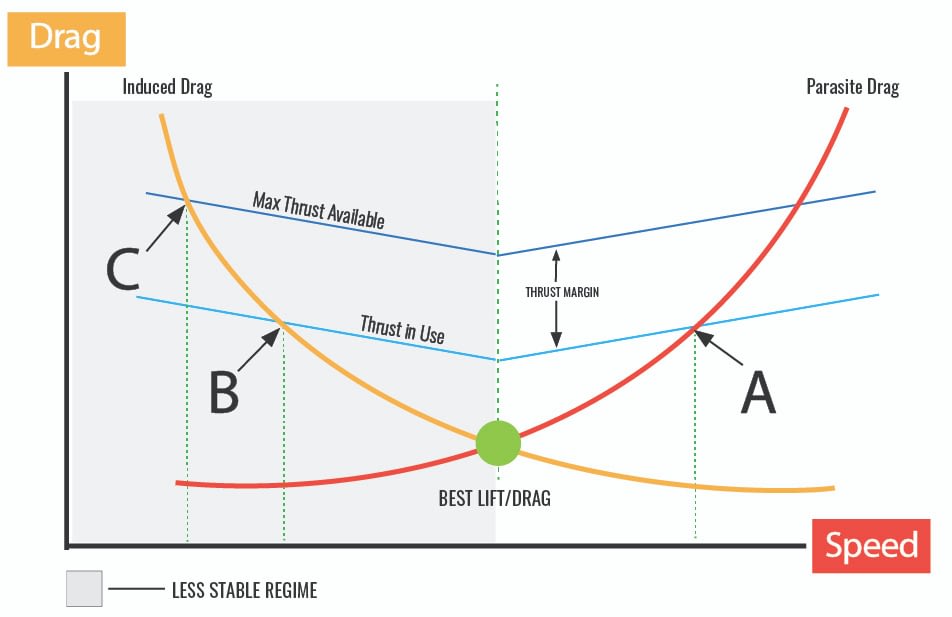
Let’s start by looking at Points A and B in the graph below (Figure 1.0).
These two points show where the thrust in use is exactly equal to the drag.
There are some interesting things going on around these points.
AT POINT A:
If we leave the thrust where it is, and disturb the aircraft so that the airspeed begins to increase, you’ll see that for any speed increase, the parasite drag must also increase.
Since we kept the thrust constant, the increase in drag will cause the aircraft to decelerate back to POINT A, right back where we started, which is good.
Now let’s look at another case.
Again, let’s look at Figure 1.0.
We’ll start at Point A, and keep the thrust constant.
If the aircraft is disturbed so that the airspeed decreases, the parasite drag will also decrease.
Since we kept the thrust constant, this decrease in drag will eventually cause the aircraft to accelerate back towards POINT A.
Again, we’re back where we started, so everything is still good.
From this little thought experiment, we can see that an aircraft at Point A:
- Will tend to return to Point A.
- Is stable with regard to speed and that’s a good place to be!
This time, let’s start at POINT B:
If we once again keep the thrust constant and disturb the aircraft so that the airspeed increases, we can see that as airspeed increases, the induced drag decreases.
This decreased drag will make the aircraft accelerate, all the way up to POINT A, at which point the drag will be equal to that at POINT B.
However, if the airspeed decreases from POINT B, notice that the induced drag increases.
This increase in drag will make the aircraft decelerate even more!
Welcome to the Region of Reversed Command.
This can easily occur in certain cases, which is why it’s important to understand just what operational choices we have at our disposal.
So, if you find yourself back here, you have two options:
If the speed is between POINTS B and C, you can see that there is still some thrust available (Thrust Margin) and you can use this excess thrust to accelerate the aircraft.
If you’ve let things go such that you’re below POINT C, then you’ve got a bit of a problem, because there is no excess thrust available.
Your only way out is to descend, trading altitude for airspeed.
Better start asking for lower.
The crucial thing to understand is that an aircraft at POINT B is unstable with regard to speed.
Remember that flight at speeds less than Green Dot, can bring you closer to this point, especially at high altitude.
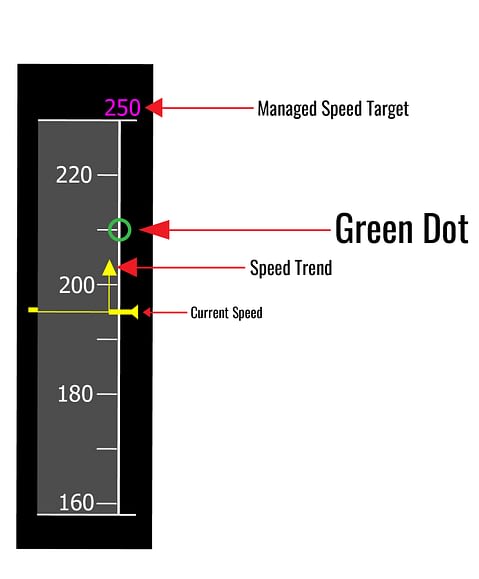
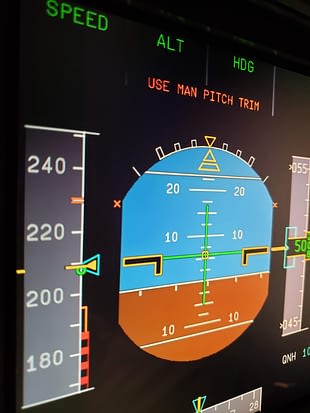
Look for the green dot on the PFD.
But remember, it’s only displayed when the FLAP LEVER is in the “0” position and the gear is not compressed.
You can also usually find a digital value on the MCDU TAKE OFF and APPR PERF pages.
Green Dot is a “characteristic speed.”
Characteristic speeds are computed by the FACs.
With both FACs working, FAC 1 supplies characteristic speeds to PFD 1 and FAC 2 supplies PFD 2.
If one FAC fails, the other FAC computes all of the characteristic speeds.
If both FACs fail, all characteristic speeds, including GREEN DOT, are lost!
In other words, you’re FAC’d!
Here’s a subtle point.
The FAC computes the characteristic speeds displayed on the PFD and the FMS computes the characteristic speeds that are displayed on the MCDU.
These are both based on the weights that have been inserted into the MCDU, so make sure you enter them correctly!
Here’s a handy rule of thumb.
Below FL 200: GD = 1.5 x GW (tons) + 110 Above FL 200: Add 1 knot per 1000 ft to the figure obtained above.
My apologies to my readers from the USA…I only know how to work in metric units.
- As per the QRH, Green Dot is the eventual speed target for a Dual Engine Failure, with or without fuel remaining.
- In a Dual Engine Failure case, the average glide distance at Green Dot with no wind is 2.5nm/1000 ft. (ROD = -1700 fpm!).
- With a FCTL SPLR FAULT ECAM, if one or more spoilers are fully extended, the speed target should be Green Dot +10. This minimizes fuel consumption.
- The best speed and rate of climb for long-term situations is between Green Dot and the ECON speed.
- When you see a “DECELERATE or T/D REACHED” message, the aircraft is suggesting that slowing down to Green Dot might be a good idea. This helps when getting high on profile.
- When clean, with full speed brakes out, VLS may be higher than Green Dot! Watch out!
- During a go-around, if, at the acceleration altitude, the speed target doesn’t increase to Green Dot, pull the ALT knob!
- Through “S” speed, before selecting flaps zero, make sure that the speed target is at least equal Green Dot.
- If the wing anti-ice is INOP and you’re picking up ice, the minimum speed is VLS +10/Green Dot.
- The aircraft’s MAX ENDURANCE (most time aloft) speed is approximately equal to Green Dot.
- Cycling the navigation database while airborne is not advised!
- Among other things, It will delete the primary and secondary flight plans.
- If the aircraft is in managed speed when this happens, then Green Dot will become the speed target.
- During a go-around, the managed speed target becomes Green Dot.
- Is the engine–out operating speed in the clean configuration.
- Corresponds to the speed that allows the highest climb gradient with one engine out.
- Is the target speed for a drift down using the obstacle strategy.
- Provides a very close estimate of the speed for providing the aircraft’s Best Lift-to-Drag ratio (L/D MAX).
As an aircraft’s altitude increases, the maximum thrust available decreases.
This is essentially the same thing as moving the dark blue MAX THRUST AVAILABLE line closer to the lighter blue THRUST line.
When we do this, you can see that Point C will move closer to Point B.
This, essentially, means that the aircraft’s available thrust has decreased.
While that’s a nice little bit of knowledge, what you really need is to know how to apply this in an operational way.
Good thing you’re here.As we mentioned earlier, when flying level at high altitude, speeds below GREEN DOT can result in a rapid increase in the induced drag.
This increase can cause the aircraft’s speed to quickly decrease even further, beyond the point at which it can be recovered using the thrust available (Point C).
So remember, when you’re up at cruise, speeds below Green Dot can ruin your day.
Keep a close eye out for changing temperatures and winds.
These are a common culprit and when the changes are large enough, they can create havoc with your speed.
And when this happens, the only way to recover may be to descend.
Better start asking for lower!
Now, let’s check out our Staff Rapper, “Bus Driva” as he shows off his Green Dot Rap!
So that’s been our Deep Dive into Green Dot.
I hope you found it informative and maybe even a bit enjoyable.
By now, you should have a slightly better idea of the importance of Green Dot and its operational context.
Be kind, be smart, fly well.
Until next time…

“Here’s a subtle point.
The FAC computes the characteristic speeds displayed on the PFD and the FMS computes the characteristic speeds that are displayed on the MCDU.
These are both based on the weights that have been inserted into the MCDU, so make sure you enter them correctly!”
Well… it is actually a little more complicated than that. There is a little bit of known Airbus “controversy” on the FAC vs FMS characteristic speeds… I’m pretty sure the FAC does it’s own “aerodynamic” calculation, independent of the values entered in the MCDU, and only the FMS uses the MCDU entered weight values… Hence the possibility of the “Check GW” message.
This can sometimes be seen in the presentation of the speeds on the speed tape, vs speeds in the MCDU Perf page… there is often, (apparently especially in certain 319s?), a little discrepancy. Often the VLS on Speed tape from FAC, and the VLS in the MCDU from the FMS are not identical… Reason is, FMS one depends on entered GW, and FAC one is an Aerodynamically calculated GW… Which is correct?? Well… Exactly, Neither!? One is based on “Average Pax/Bag Weights” the other is a calculation with a value of +/- 3 knots. PLUS, in addition to all that, there is also the possibility of simply an Aircraft Operating Empty Weight error, because even if the entered Payload were magically exactly correct, if the aircraft OEW is not also exactly correct, then again, the FMS speeds will be off.
Also it should be mentioned that AB has “updated the software” on newer planes and now the FAC and FMS are both reportedly using MCDU based data… So clearly AB prefers the errors from the W&B data to the errors from the Aerodynamic calculation. However, the Aerodynamic calculation still exists, simultaneously by the FAC, “in parallel,” and this is seen because the Check GW message still exists, as a backup and gross error check. Anyway, Less visible discrepancies on the newer planes.
G’day BusDriver!
Firstly, my apologies for your comment taking so long to get posted.
Long story, but I had approved and replied to it ages ago, but it was lost somewhere on the backend of the website…my webmaster recently located it, and so I’m re-replying!
As always, thanks for some very astute observations.
My FCOM shows that the FACS actually make two different computations.
First, the FAC computes operating speeds based on the FMS gross weight, which allows the system to have consistent and accurate speeds on both the PFD and MCDU. This computed GW is based on the GW calculated on the ground. It is updated once airborne using a calculation process which derives this figure from the aircraft’s AOA!
In addition, the FAC also computes its own GW and CG based on aerodynamic data, which are used by the ELAC and the FMS for the gross weight crosscheck (“CHECK GW” MCDU message). This calculation is also used as a backup for speed computation in the event of a dual FMS failure!
All of this raises the critical point that if a pilot enters an incorrect ZFW on the MCDI INIT Page, the GW (and, to a lesser extent the CG) computed by the FM will be wrong.
This will result in the following:
1. FM predictions and speed are erroneous.
2. Incorrect GW and CG on the MCDU FUEL PRED page.
3. Incorrect GW on the ECAM Systems Display (SD).
4. Characteristic speeds on the PFD are incorrect.
5. SRS mode guidance is affected if VLS is greater than the V2 entered in the MCDU PERF TAKEOFF page.
It’s easy to see that ZFW entries are important and should be checked by both pilots on the flight deck.
Should the “CHECK GW” light come on, crews should recognise that there is a discrepancy between the FM computed GW and the FAC computed GW.
Thanks again for starting an interesting discussion BusDriver!
Cheers!
Skip
Yikes! Hence the various interesting conversations about Sully and “The Flare”